Table of Contents
- Creating a code snippet
- Running a code snippet
- Debugging code snippets
- Quick access to snippets
- Snippet use-cases
Sources view in Chrome Developer Tools has a code snippets feature, kind of like a built-in text editor, that allows to write, debug, save and re-use code snippets.

Creating a code snippet
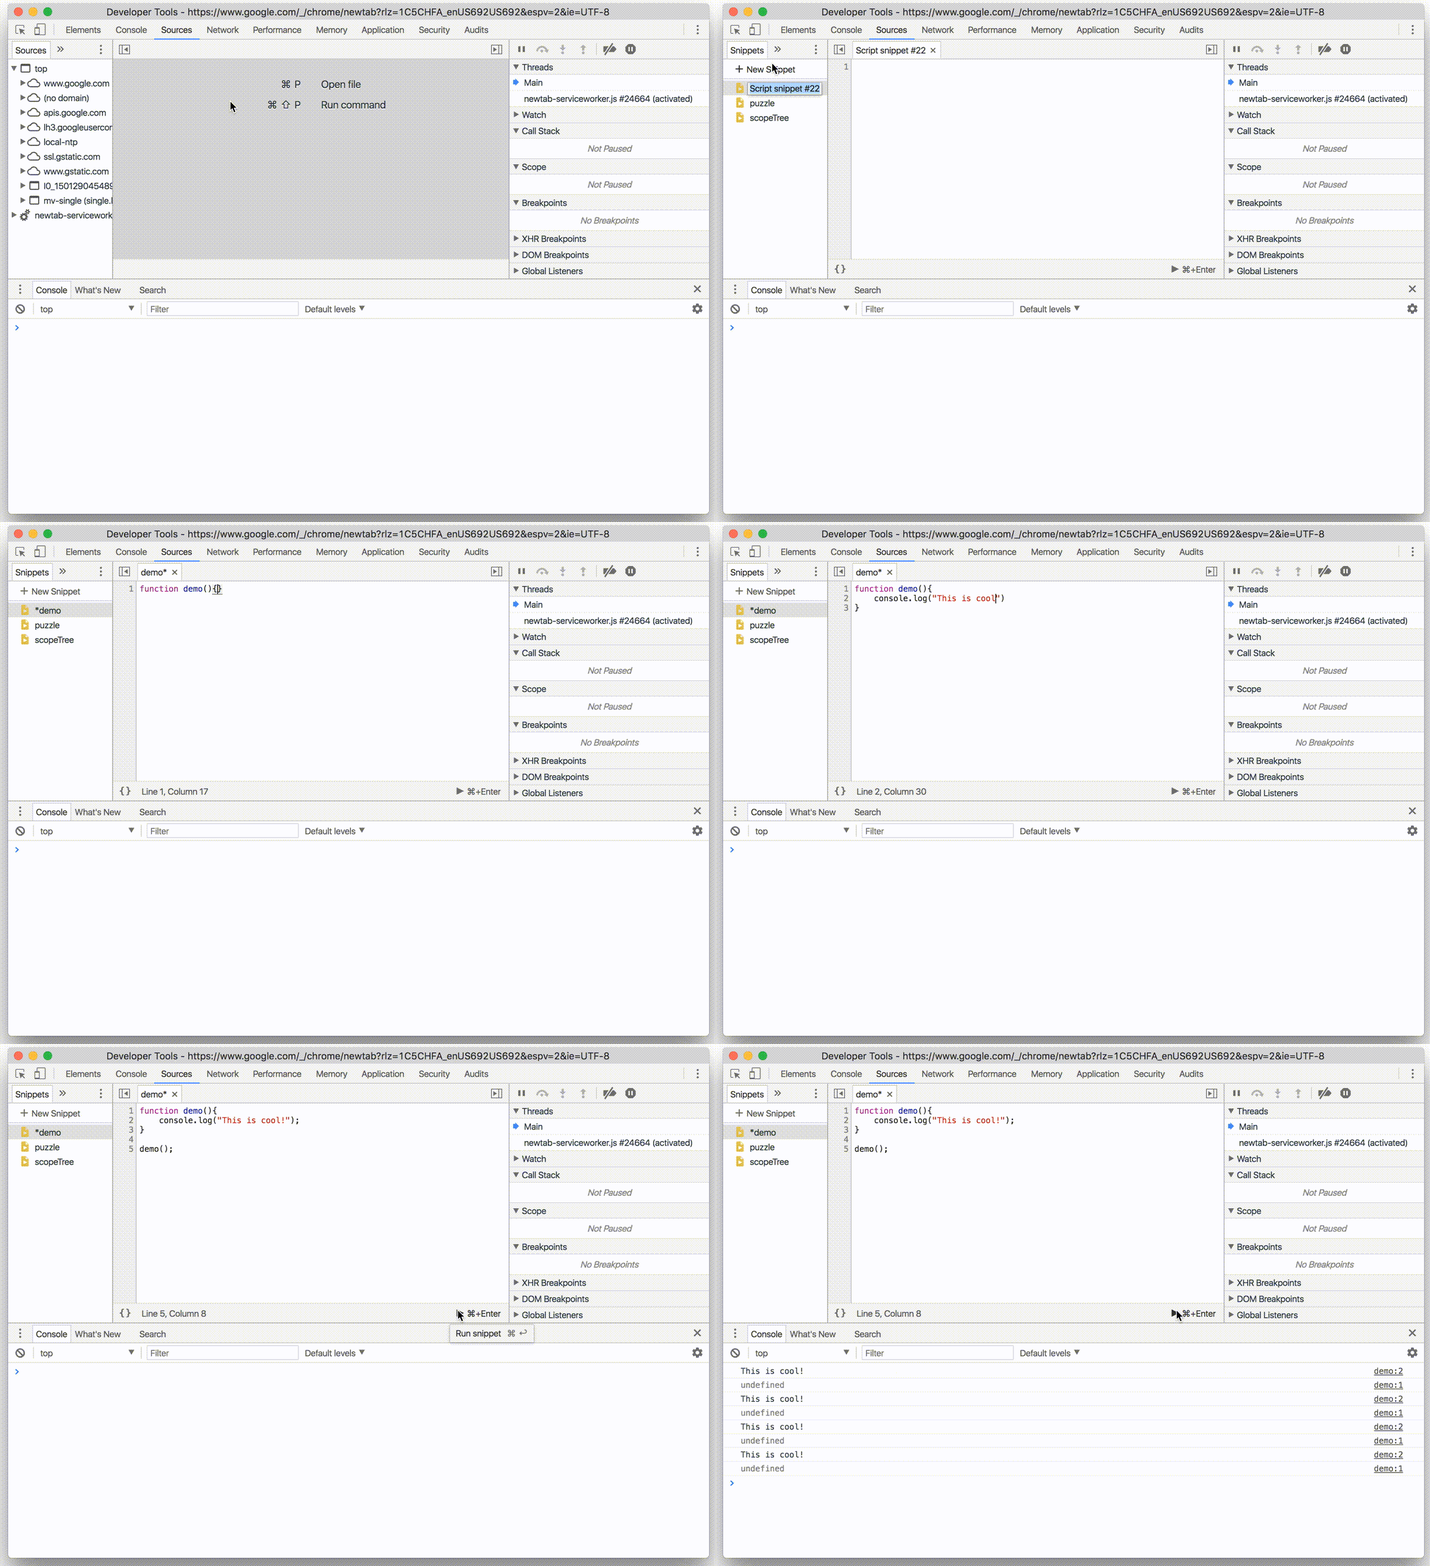
To get to code snippets:
- Open the Developer Tools
- Navigate to Sources at the top menu
- Select Snippets in the left menu (see the image above).
- Click on “New Snippet” button
Once the new snippet is created, it can be edited and debugged like any other JavaScript file.
Running a code snippet
Snippet can be run in two ways:
- By hitting the small play button to the bottom right of the snippet
- By hitting
"Command + Enter"on Mac or"Control + Enter"on Windows
Debugging code snippets
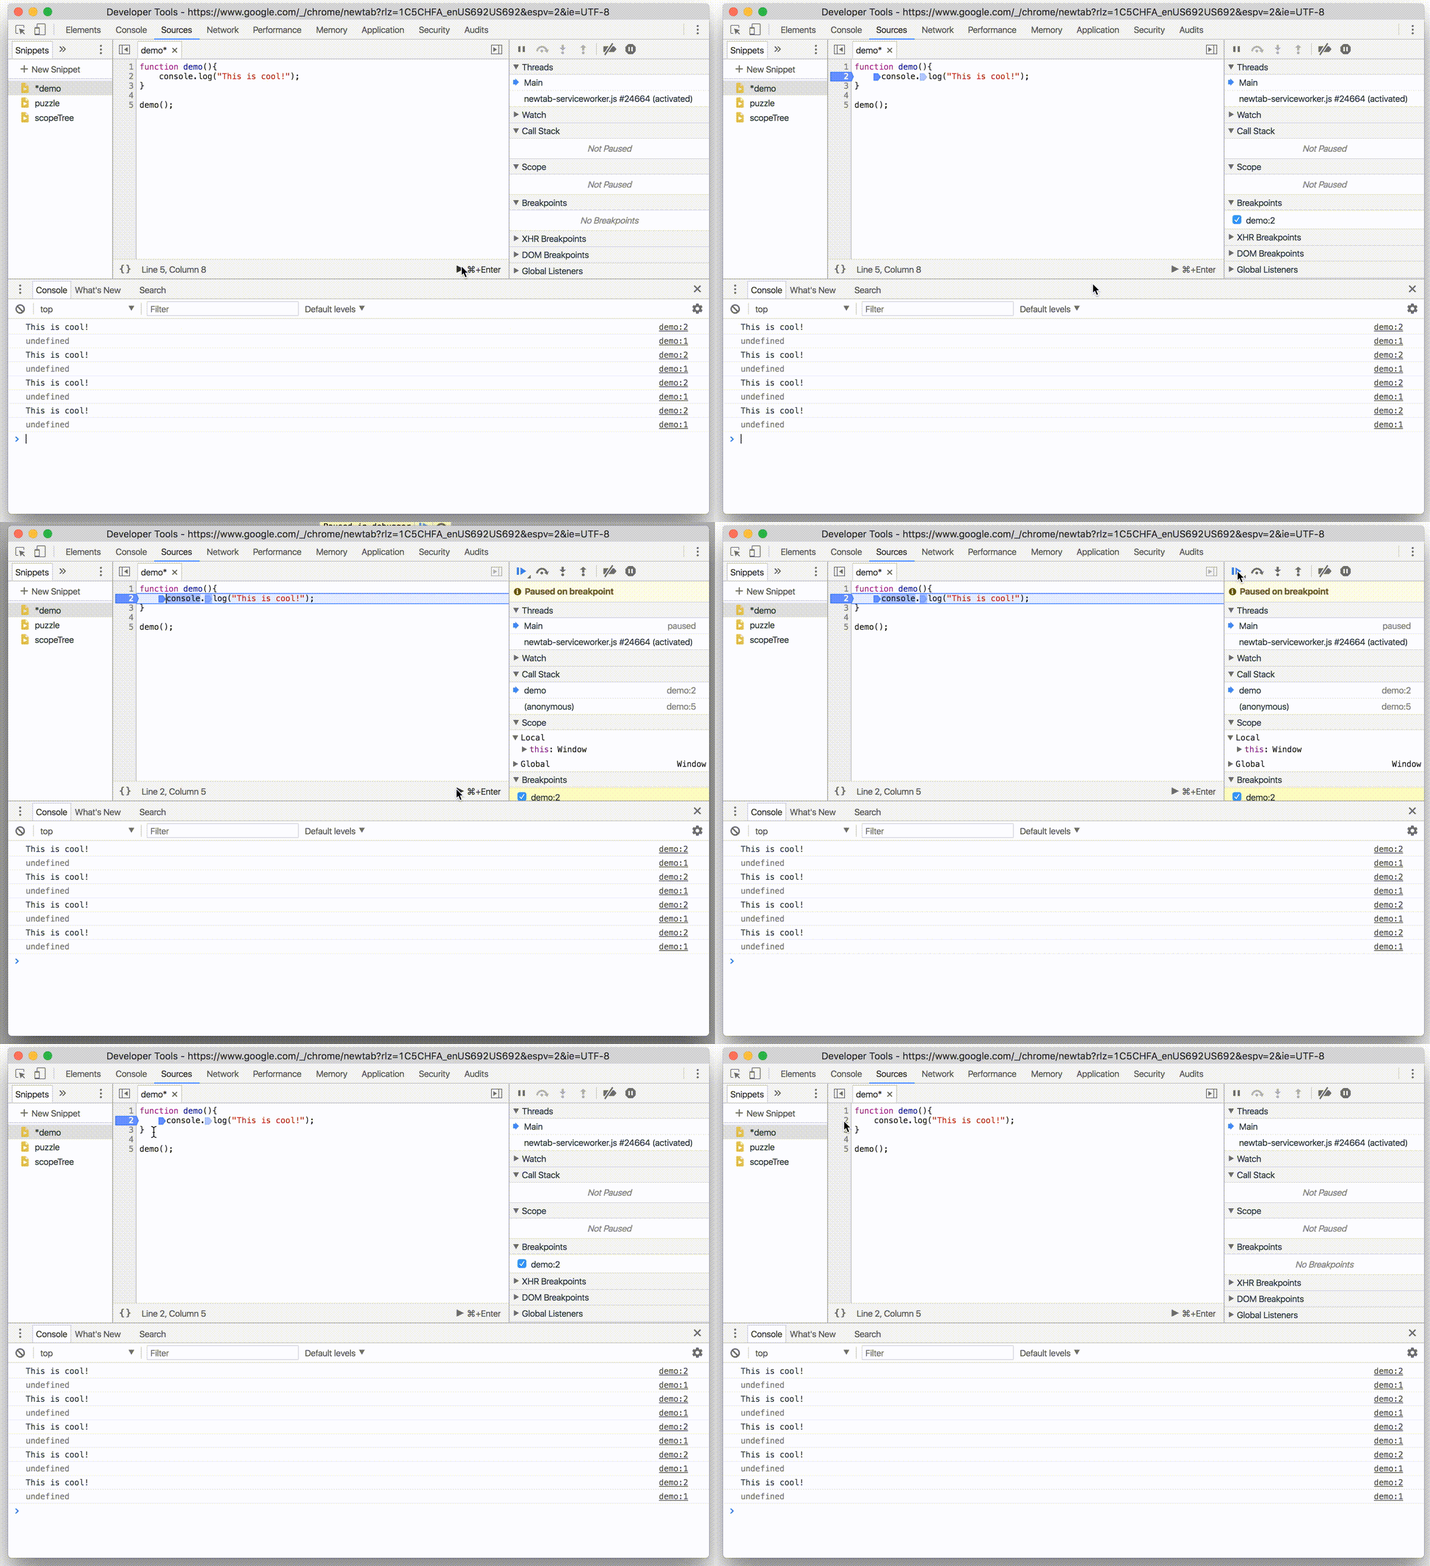
Break points can be added into code snippets, just like any other JavaScript file loaded in Chrome Dev tools.

Quick access to snippets
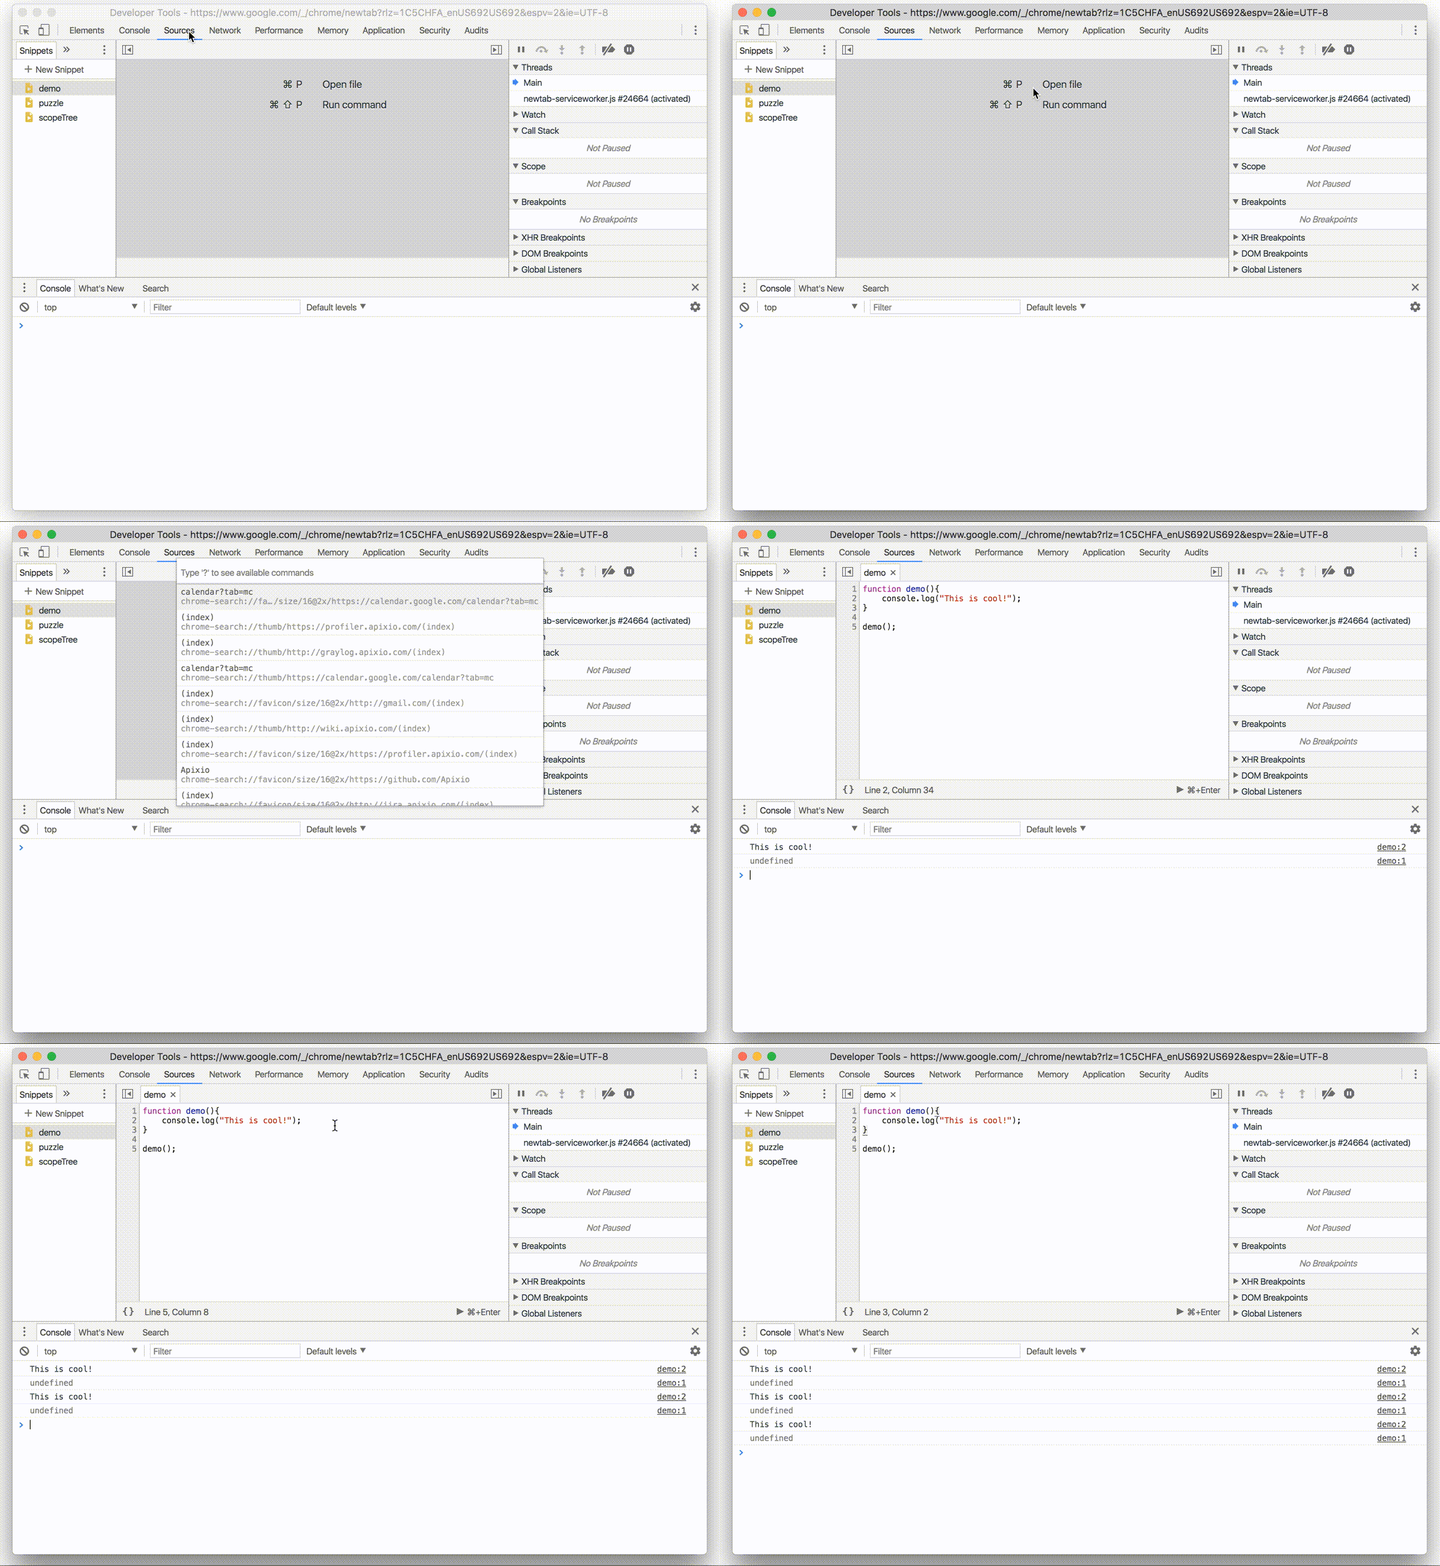
Existing snippet can be opened through the source tab or by hitting a "Command + P" shortcut on Mac or "Control + P" on windows. This will open a fuzzy selector in which a snippet name can be entered.
Hitting "Command + Enter" on Mac or "Control + Enter" on Windows will execute the snippet.

Snippet use-cases
Snippets are great for ad-hoc prototyping and debugging.
In addition snippets can be used to save common debugging helper functions for quick re-use. There are libraries of snippets out there. One such library is code-snippets which, among other things, has a detailed page timing snippet and css layout snippet that draws boundary around every DOM element.
How to run snippets of JS on any page from DevTools: https://t.co/6K7VdM0a3M
— Chrome DevTools (@ChromeDevTools) January 2, 2018
Do you have any snippets that you like to use? Please share in the comment area bellow.